

Ma méthode est personnelle, vous pouvez sans problème la modifier et la complexifier.
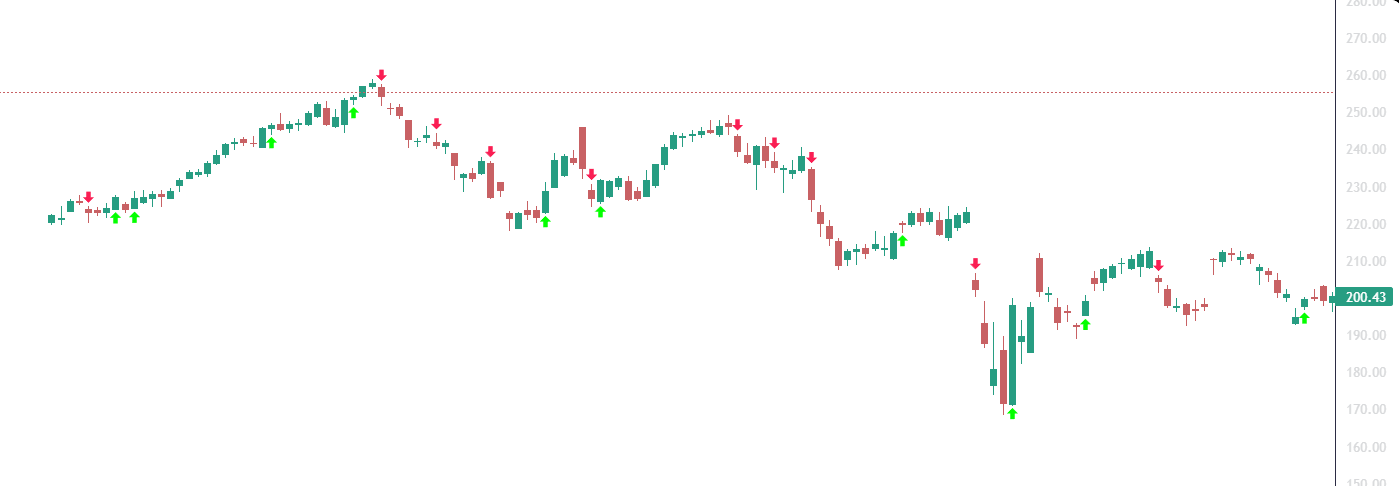
Pour commencer, n’oubliez pas d’installer les différentes bibliothèques importantes.
PYTHON
pip install yfinance lightweight-chartsVoici maintenant le code complet à coller directement dans un notebook. Si tu utilises un IDE, il faudra l’adapter pour cela, réfère-toi à l’article que j’ai rédigé sur Lightweight Charts.
PYTHON
import yfinance as yf
from lightweight_charts import JupyterChart

# Récuperation de données
df = yf.download('AAPL', period='300d', interval='1d')[['Open','High','Low','Close','Volume']]
df.columns = ['open','high','low','close','volume']
df['time'] = df.index.strftime('%Y-%m-%d %H:%M:%S')
df = df[['time','open','high','low','close','volume']]
df.reset_index(drop=True, inplace=True)

# Préparation des données avec shift
high = df['high']
high_prev = high.shift(1)
high_prev2 = high.shift(2)

low = df['low']
low_prev = low.shift(1)
low_prev2 = low.shift(2)

close = df['close']
close_prev = close.shift(1)
close_prev2 = close.shift(2)

# Création Highs et Lows
high_mask = (high_prev > high_prev2) & (high_prev > high) & (close < low_prev)
low_mask  = (low_prev < low_prev2) & (low_prev < low) & (close > high_prev)

swing_highs = df[high_mask].reset_index(drop=True)
swing_lows  = df[low_mask].reset_index(drop=True)

# Affichage
chart_lightweight_charts = JupyterChart(width=1400, height=600, toolbox=True)
chart_lightweight_charts.set(df)
chart_lightweight_charts.layout('#FFFFFF')
chart_lightweight_charts.grid(False, False)

for time in swing_highs['time']:
  chart_lightweight_charts.marker(time, 'above', 'arrow_down', '#FA1E53')

for time in swing_lows['time']:
  chart_lightweight_charts.marker(time, 'below', 'arrow_up', '#04FF00')

chart_lightweight_charts.load()
À très bientôt dans un autre article.
ACCÈS MEMBRES
Accès à la newsletter et contenus exclusifs.